

DNS analytics
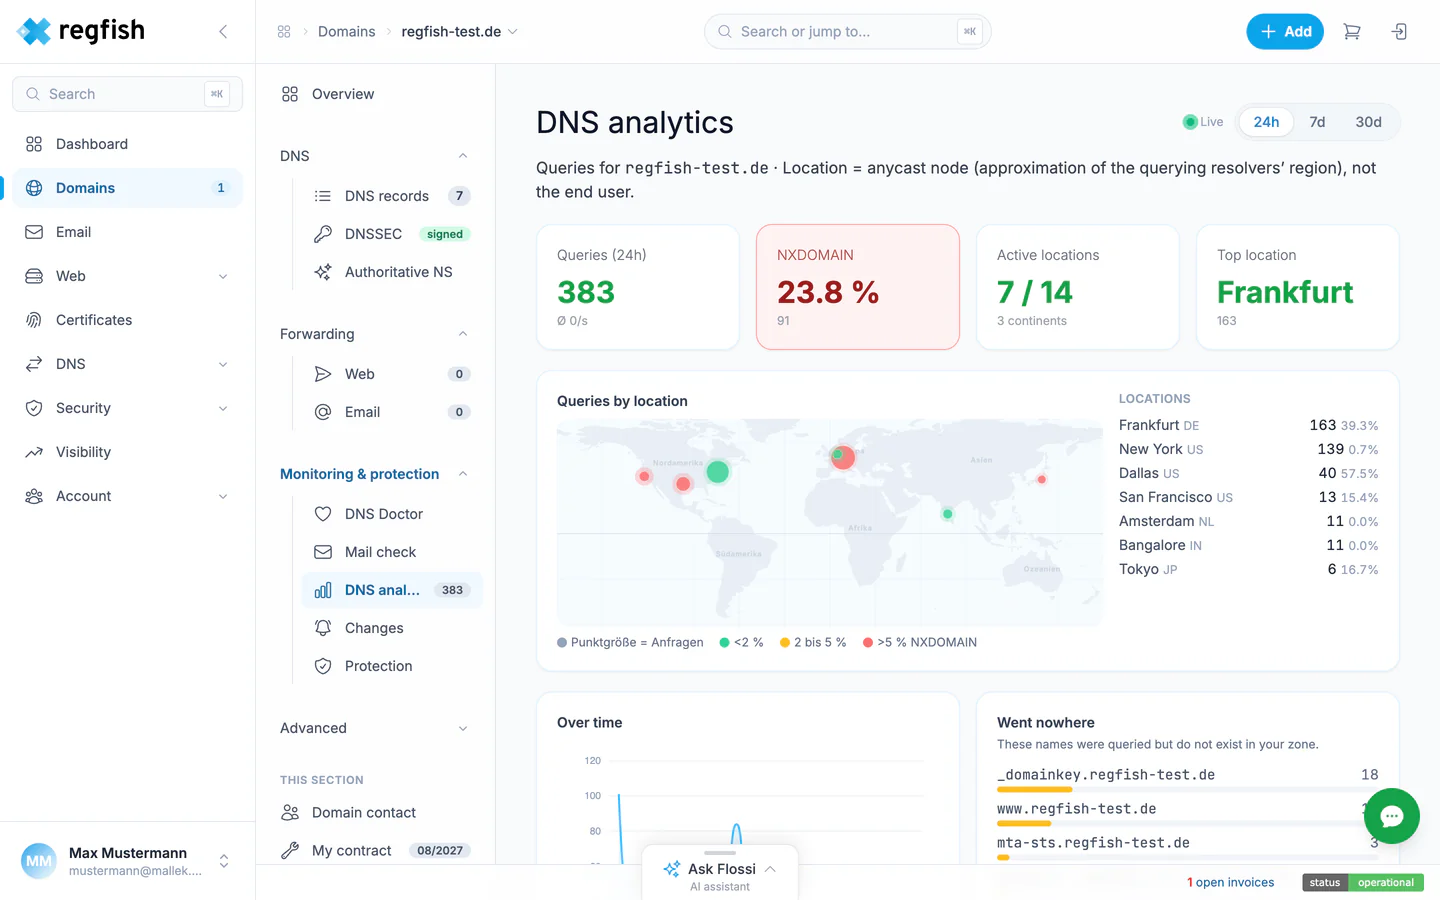
DNS analytics shows what actually arrives at the nameservers: how many queries, answered from where, and how many of them lead nowhere.
Where to find it
Section titled “Where to find it”Domains → your domain → Monitoring & protection → DNS analytics, direct address:
dash.regfish.com/my/domains/<tld>/<sld>/analytics
What the numbers mean
Section titled “What the numbers mean”Ranges: live, 24 hours, 7 days, 30 days. Plus four key figures:
- Queries in the range, with the per second average.
- NXDOMAIN share: queries for names that do not exist in the zone. A few percent are normal (typos, scans). A sudden rise usually means something out there still points at a name you deleted.
- Active locations out of 14 anycast nodes on three continents.
- Top location by queries.
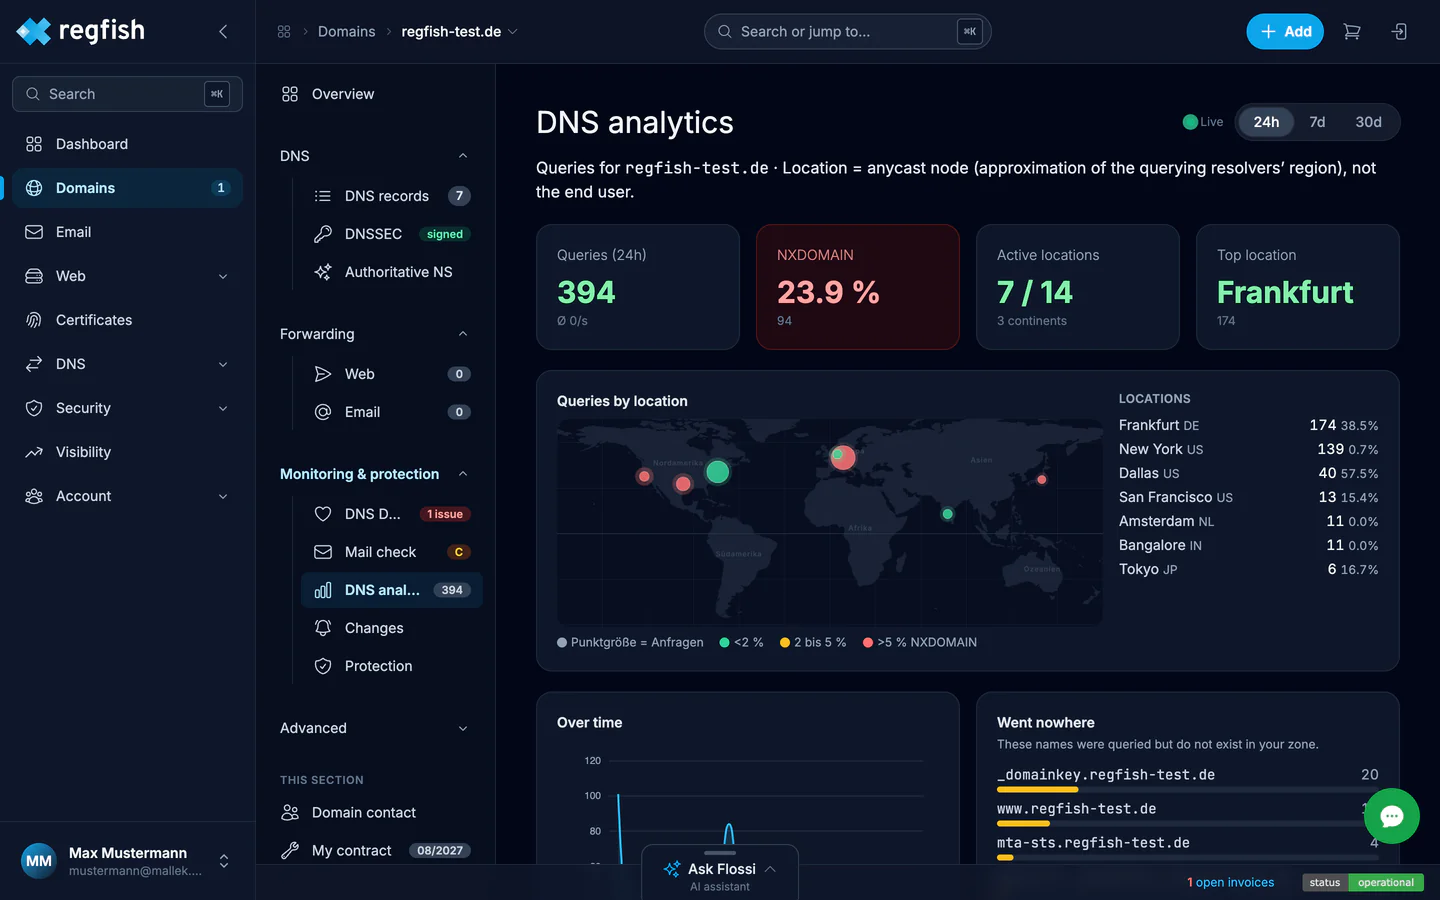
The map shows volume per location (dot size) and the NXDOMAIN share (color).
What the location tells you, and what not
Section titled “What the location tells you, and what not”The page says it itself, and it matters: the location is the anycast node that answered, an approximation of the region of the querying resolvers. It is not an end user location. A user behind a central DNS resolver shows up where their resolver sits, not where they are.
What it is good for
Section titled “What it is good for”After a migration, analytics shows whether the new zone is being queried. After deleting old records, the NXDOMAIN share shows whether anything still asks for them. And a domain with permanently zero queries is a good candidate for cancellation.